
LineMetrics Cloud
The central cloud platform for analysing building data, managing measurement points and controlling access rights.

Access 24/7 worldwide via web browser or app
Analyze your measurement data in real time and retrieve the device status at any time and from anywhere.

Individual dashboards and alerts
Create dashboards with the metrics that matter to you. Define thresholds for alerts.

Permanently secure data storage
Your data is stored securely and encrypted. All past data will remain available to you.

Reuse your data wherever you want
Export data/graphs for presentations, reports, and Excel sheets. You can use the API to connect existing systems.

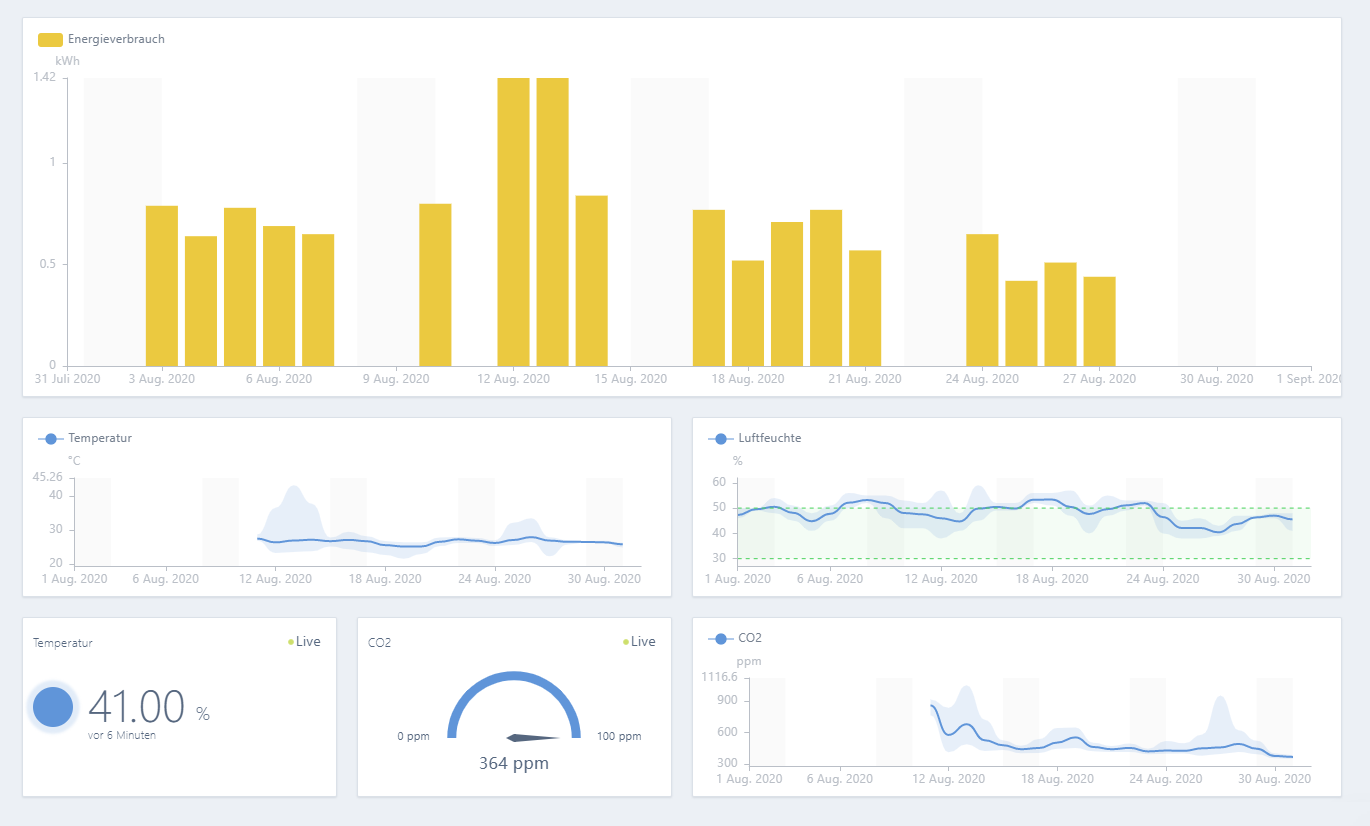
Intuitive, real-time analysis of your data
View individual data streams over time and use the zoom function to take a closer look at details. Compare the values of different time periods (e.g. current vs. last year) to immediately detect deviations.
Consolidate key metrics into easy-to-read dashboards. Define a traffic light icon that shows whether readings are in the red, yellow, or green range. Calculate your own key figures, such as consumption per square metre.
Easy user management
Give the various stakeholders access to all or selected real-time building data: from corporate headquarters to employees at local locations to external consultants.
New, additional users can be created at any time. It is also easy to manage user rights and roles.


Individual alarm messages
Define individual threshold values for any measurement point. If these are exceeded or undercut, a warning message is sent by email and/or SMS.
To optimize notifications, you can also combine two conditions (thresholds/metrics). In order not to receive an immediate warning message in the event of short-term overshooting or undershooting, a trigger delay (e.g. 15 minutes) can be set.
Permanent data storage
All measurement data are stored permanently and in the highest temporal resolution in our database. You can access, export or query all your data via API at any time and from any location. A multi-redundant server infrastructure with 24/7 monitoring guarantees the highest availability of our services and a quick response in the event of unforeseen events.
A parallel backup or copy of the data in a separate database is therefore not necessary.


Security by Design
During the development of the LineMetrics platform, special attention was paid to data security. The LineMetrics security concept is based on several pillars, first and foremost end-to-end encryption, high-security data centers in German-speaking countries and independence from the company network.
Export data easily and flexibly
It is only through the analysis and further processing of the measurement data that real insights and practical added value are created. That’s why we make it as easy as possible for you to work with your data.
In addition to the analysis in the cloud itself, you can save all diagrams as an image (PNG format) and thus easily use them for reports or presentations, for example. An export function as a CSV file makes it easy to use the data in Microsoft Excel. The LineMetrics API is available for automatic connection to existing systems.

It’s simple: see for yourself


The most important features at a glance
Analysis
- Various visualization options (bars, lines, dial gauge, etc.)
- Design of diagrams/curves with individual colors, icons, etc.
- Creation of individual dashboards
- Predetermined or individual time periods
- Comparison of two periods
- Values at intervals from 1 minute to 1 day
- Individual key figures (number of values, smallest/largest value, sum, average)
Alerts
- By email or SMS
- If the threshold value is exceeded or fallen below
- Combination with second threshold
- Trigger Delay (Tolerance Value)
- Individual Recipients, Subject, Content
Privacy/Security
- End-to-end encryption
- Web interface with 256 bit encryption
- Server infrastructure with multiple redundancies, exclusively in German-speaking countries
- Ongoing security updates
Data access and export
- Via web browser (no installation required)
- Via mobile app (for iOS and Android)
- Direct access to individual objects and measured values via QR code scan
- Publish dashboards (without login)
- Data export as CSV file (for Excel)
- Diagram export as PNG image
- REST API
- MQTT Service
Device & User Management
- Sensor and battery status, signal strength
- Different roles: Administrator, User, Editor, Guest, Restricted Guest
Asset Management
- Upload of PDF documents for each object (e.g. checklists, repair instructions)
- Upload photos to any object
- Definition of various object properties
Other
- Cloud branding with your logo
- Permanent data storage at maximum temporal resolution
- Ongoing updates and new features
- Integrate existing digital measured values (Modbus TCP, BACnetIP, OPC-DA, OPC-UA)